

Geopolitical uncertainties on infra investments
Infrastructure investors have rarely faced such a breadth of challenges as they do today. Sabre rattling across regions is fueling protectionism while dampening economic activity according the IMF. Infra investors are not new to these political upheavals, in some ways, many are borne from them.
Investors in infrastructure expect steady cash flows. Yet, political, regulatory and various economic risks over the 20-30 year lifecycles can quickly dampen cash flow projections and even cost investors money. This article focuses on a new quantitative methodology that can help infrastructure stakeholders anticipate, manage and hedge against these risks.
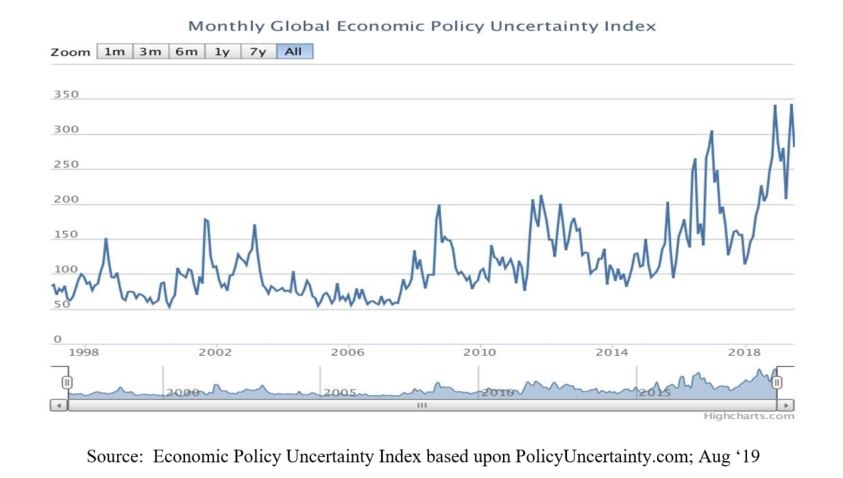
According to the Economic Policy Uncertainty Index, global risks are rising to almost an all-time high. In such an environment, infra investments are perhaps the “canary-in-the-coalmine”. Germany is flirting with a recession, while the US and UK – as opposed to emerging market players – further fuel the growing “wall of worry”. Investor appetite often wanes for long-term investments until more clarity around the future visibility appears.
This uncertainty has emerged from the most unlikely places. Even in Norway, the Government has rescinded on infrastructure agreements. “Government predictability is very important, but if you cannot get it even in Norway, there is a problem,” said one investor in a news report this summer.
Another example of how political and regulatory volatility can quickly translate into huge losses was exemplified in the case of Spanish airport operator Aena, which went public with all of the country's airports. The Spanish government moved to reduce the tariffs airports could charge, despite contracts fixing them for 10 years.
The Children's Investment Fund (TCI), a large UK investor in Aena, alleges that the tariff reduction reduces Aena’s value by $1bn. The surprise action “creates legal uncertainty not only for investors in Aena, but in all Spanish regulated entities” according to TCI, adding “damage confidence in Spanish capital markets by raising questions over whether the rule of law will be upheld”.
Political risks are rising everywhere
What is the real political risk exposure for infrastructure projects? Whether you have a project in development, production or near the end of its lifecycle – rising political risk affects the infrastructure asset class substantially.
If you follow the data, the evidence is clear. Empirical record demonstrates that political, economic and lifecycle risks are routinely underestimated, until they surface in moments of sobering volatility. Risks that emerge beyond the scope of the original development, say years three-through-30, are often back-benched to the more pressing development, construction and financing risks here and now.
Stakeholders on infrastructure projects routinely underestimate dynamic risks in later years. Roughly, half of a project’s value – defined as net present value (NPV) – comes from the years after design and construction. The data is clear: such risks have a large probability of emerging over time.
The longer the lifecycle, the higher the probability such risks will emerge. One of the many virtues of infrastructure investing is its relatively stable return profile. This implies a revenue predicated upon a reliable business model of stable cash flows, yielding a positive value spread above risk.
This in turn, yielding a positive project NPV, is at the heart of the capital asset pricing model (CAPM). More rigor must be applied to assess these risks, particularly risk likely to occur but hard to predict – as these risks don’t follow standard distribution or bell shaped curve… just the opposite.
Why do we acknowledge but underprice these risks, specifically political, economic and lifecycle risks? Perhaps this occurs as a result of:
- cognitive biases – confirmation, anchoring, etc.
- kicking-the-can-down-the road – getting the deal done now and worry about performance later
- a function of an “agency” issue – other people’s money
Whatever the cause, investors relearn the lessons in almost every market cycle.
Can benchmarking using data analytics reduce risk?
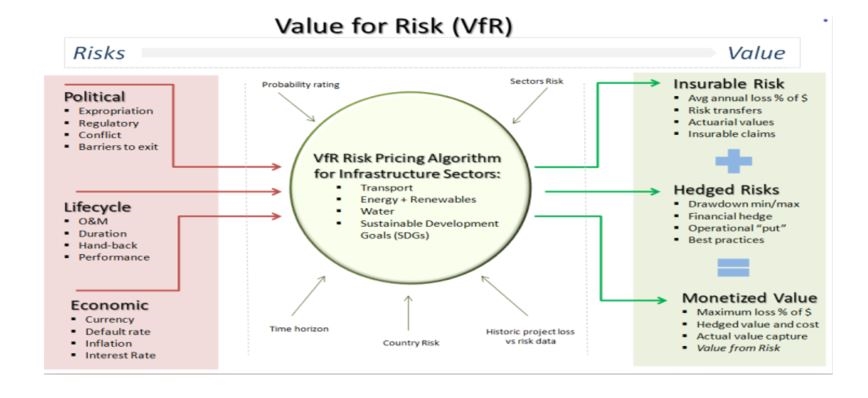
The remainder of this article outlines a new approach. Value for Risk (VfR) is a dynamic risk benchmarking tool designed to identify, measure, track and monitor, and empower actionable management to reduce real risk.
Employing machine learning, VfR is designed to measure risks such as economic risks, political risk as well as lifecycle risks, which have large scale negative impacts on infra assets and portfolios, whether public or private. The chart below briefly summaries this outline.
- Political Risk
- Lifecycle Risk
- Economic Risks
Political Risk, by our definition, goes beyond currently offered by insurance providers, to include not only coverage for expropriation, currency convertibility, conflict and other aspects. But instead includes regulatory changes such as subsidy support and governance enforcement factors. It's not enough to slap a simple “letter rating” on a country and its dynamic political landscape derived from sovereign risk premia and credit default swap pricing. These core formulations are based upon CAPM, using a “risk free rate”, and depending on your appropriate benchmark, this is a negative rate such as with the ECB or German Bund. Negative rates from central banks around the world are altering the very foundations of outdated risk analytics. Project risks remain elevated despite inexplicable negative rates worldwide. Risk in infra segments is much more real, it lives in operating processes and protocols in real time. For example, we published an article recently about the changing regulatory adjustments pulling subsidy support from European Wind Sector in July 2019. Laws change frequently, sometimes voiding key provisions, as was the case with 2014 FIT changes in Spain.
Lifecycle Risk has always been a source of deep concern to all owners and operators. The adoption of Internet of Things (IoT) and big data sensor analytics has been steadily gaining acceptance. This enables data to be collected and monitored to identify “actionable” steps on dynamic risks in real time. This is not data in and data out, to the contrary, IoT analytics informs real-world metrics to quantify risks emerging at different phases of the lifecycle. Reducing risk over time is a difficult challenge for projects in almost every sector from renewables through to transport, water and beyond. The networked world allows “actionable data” to integrate practical tool to manage risk. For example, deferred maintenance is the nemesis of lifecycle benchmarking. Something simple like compounding deferred maintenance can exhibit an “inverse square” rule whereby costs explode by delaying simple protocols, which can often lead to expensive performance degradations.
Economic Risks go well beyond default risks, which rarely occur. Infra sectors are deeply affected by changing economic conditions. This results from volatility in currency denominations, interest rates normalization, unexpected swings in capital flow, as well as long-term inflation and erosion of purchasing power. However, over the course of 100 interviews, we were amazed to find a relaxed attitude about these risks, until the need is acute. The growing wave of volatility and fears of disorderly adjustments have a direct shock to infrastructure asset classes. Financial risk exposures need active management. For example, volatile capital flows in 2018 resulting from US central bank interest rate normalization, created a whiplash for many stable countries in Latin America. Usually an outright default is the last thing to occur, but instead adjustment shocks – such as inflationary spikes – can take a bit out of the real economy and investor confidence. As a result, owners and operators must employ the best practices to hold down risks in a more volatile world.
How does this work?
Risks dynamically rise and fall, changing and mutating over time – they are neither fixed nor static. Most approaches are a “snapshot” and few actually present an actionable fix.
VfR simplifies everything into actionable project risks. The benchmarked risks are “priced” into the cost of capital. See the outline left.
Each risk is benchmarked. Probability profiles are quantified as to how, where and when each metric is likely to originate. A matching algorithm is employed to match profiles with risk management protocols, consisting of best practices from an empirical datasets. Double counting is avoided to through the risk score indexing. Lastly, the actual value of each protocol to quantify is assessed against the overall project.
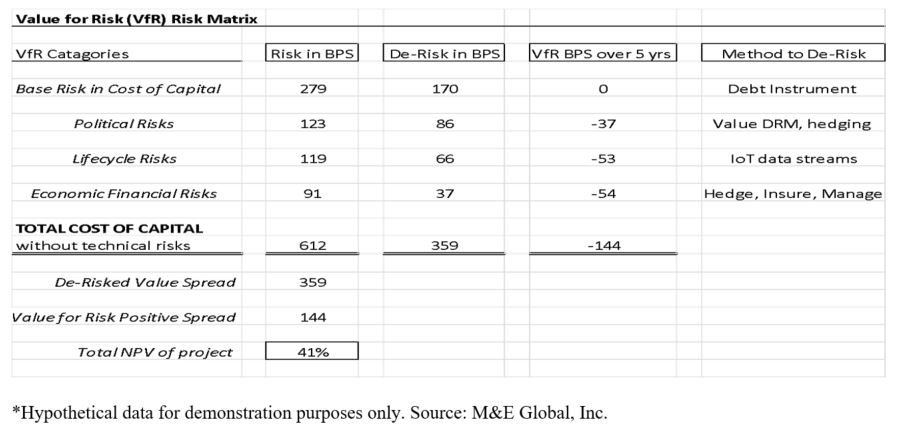
Benchmarking each risk to measure its impact (both negative and positive) sounds quite simple but is difficult in practice. VfR is scoring benchmarks project risks versus the credit of the debt sponsor. The gaps are often large. Debt instruments are credit-driven, designed to support a steady stream of repayments. They do not actually (or accurately) price risks on a project. They price market demand for debt.
For example, the project risk above is the total cost of capital method is 6.12%. Therefore the total value created is equal to a dynamic means of 1.44% or 144 BPS every year over the project tenor. In other words, 41% of the NPV of the project is captured by actively managing down risk. That has significant material impact in creating value for the project owners.
However, these risks are constantly changing over their lifecycle. What impacts value today will certainly change over the next 10 years. This dynamic modeling allows for flexible management protocols. Having a static view of risk analytics is the equivalent to horse and buggy policies in the age of driver less vehicles.
Why VfR is superior
As noted previously, the tool must fit the challenge. A flashlight to illuminate a dark corner doesn’t work during daylight. So too, VfR is a dynamic lifecycle benchmarking tool designed to quantify and monitor changing risk profiles over time. Most analytical tools quantify the statistical profiles with the inherent embedded flaws. This is a major gap in the reasoning.
VfR is specifically employed for infrastructure benchmarking. Other methods are widely used such as Monte Carlo, Real Option Analysis, Scenario Analysis, and Mean Variance.
They are limited in their ability to capture real-world risks for infrastructure assets over long durations. For example, while Monte Carlo is useful, it assumes a standard distribution model for risk parameters.
If your risks are predictable and follow a standard distribution then MCV is a decent choice. However, complex risks negate the value of MCV as simple doesn’t work. Real Option Analysis (ROA) is limited by its mathematical formulations and rigid modalities. Scenario Analysis, while popular, can’t account for the probability of an occurrence within a scenario based on empirical data. Mean Variance Portfolio (MVP) theory narrowly focuses on monetary effects constrained by standard distribution risks within a diversified portfolio.
Each is good and accurate in the right situation, but none take a bottoms-up approach to measure real-world risks that affect infrastructure assets. VfR is specifically designed towards the infrastructure asset class and idiosyncratic risks of each segment.
Political, economic, and lifecycle do not follow standard distribution models. In fact, many take on the profile of a power laws, barbell shape curves, fractal patterns and other weird profiles.
These risks are complex and often imply non-linear dynamical profiles over time. Infrastructure project risks don’t fall into simple explanations.
Request a Demo
Interested in IJGlobal? Request a demo to discuss a trial with a member of our team. Talk to the team to explore the value of our asset and transaction databases, our market-leading news, league tables and much more.