

Data Analysis: What's behind the UK’s green growth?
The UK's energy ministry released data on the nation’s renewables capacity and share of the power generation market in 2015 and 2014 at the end of March 2016.
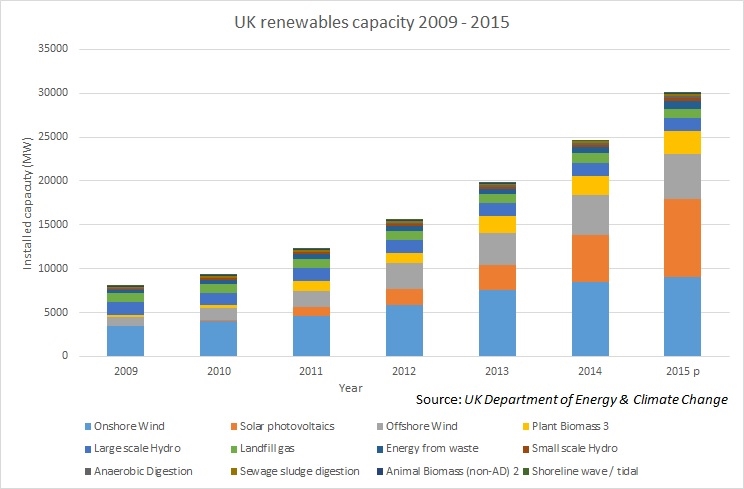
In the face of a raft of cuts to renewables subsidies, the statistics show strong growth. As the graph below shows, by the end of 2015, the UK’s renewable electricity capacity totalled 30GW. This is a 22%, or 5.4GW, increase compared to the total capacity installed by the end of Q4 2014. In 2015 renewable generation represented 22.3% of the UK’s gross electricity consumption, a 4.4% increase on 2014’s share.
The figures support the idea that the UK enjoys a burgeoning renewables market, buoyed by functioning state support. But a number of other factors may have driven this growth.
At the mercy of the elements
The notes accompanying the data release point to how susceptible renewables generation figures can be to factors outside human control – namely, whether the wind blows and the sun shines. The government estimates onshore wind’s average load factor (how much power a project actually produces, compared to its nameplate capacity) in Q4 2015 stood at 37%, 4.2% higher than a year earlier. Wind speeds in Q4 2015 were on average 0.9 knots higher than in Q4 2014.
Offshore wind’s load factor rose by 3.4% compared to 2014 Q4, from 48%, to 51% for the same reason - late 2015’s high winds. Higher Q4 2015 rainfall boosted hydro production, too.
Subsidy free?
The data will no doubt be used to assert the government’s belief that renewables projects can – and should – be increasingly unreliant on subsidies. That the industry is growing in capacity year-on-year suggests a thriving industry, that is outgrowing its need for government stabilisers necessary during its infant years.
Yet the capacity that became operational in 2014 and 2015 was underpinned by earlier, more generous support mechanisms, like the renewables obligation (RO) scheme. The graph shows a strong solar PV capacity increase during 2015 – up by 3.5GW. But the majority of growth came from large-scale sites under the RO. The bulk of these installations took place early in the year as developers rushed to complete deals ahead of the closure of the RO to large-scale solar in April 2015.
Future skews
2016 heralds the entrance of other sources of generation. A number of projects employing less well-established technologies have entered the UK development pipeline in 2016. Battery storage, small, modular nuclear units and pumped hydro storage are now all being actively developed.
This is the growth story which runs behind the renewables industry – that of the transmission, storage and modular energy industries. The need to replace the traditional baseload-driven energy market to accommodate the fragmented, fluctuating nature of renewables means these new forms of producing and storing energy will likely begin to enter operation, affecting the need for greenfield renewables as existing capacity is optimised and power is shared.
For example, once transmission links like Eleclink are operational, the UK’s clean capacity data will be increasingly impacted by the renewables usage of the countries it buys power from. Demand for new projects could be impacted by the increased availability of foreign power. Solar storage systems like E.ON’s newly-launched Aura product in Germany could improve efficiency, potentially reducing demand for new capacity.
In 2016, earlier support mechanisms have been stripped out in favour of the contracts for difference auction system and state support for onshore wind and solar has tumbled. The figures for 2014 and 2015 look good, but the annual capacity and generation data for the coming years will tell the story of 2016’s true investment climate.
Request a Demo
Interested in IJGlobal? Request a demo to discuss a trial with a member of our team. Talk to the team to explore the value of our asset and transaction databases, our market-leading news, league tables and much more.